Web UI
dccd ships a small web UI — a dashboard to watch collection, browse stored data, run backfills and control streams without touching the CLI. It is a pure client of the HTTP API: every action is just an API call, so nothing is hidden from scripting.
Running it
dccd ui                     # UI + API only (no scheduler)
dccd start                  # full daemon: scheduler + streams + UI

dccd ui --host 0.0.0.0 --port 8080
Both read settings.ui_host / ui_port from the config. Requires the extra:
pip install "dccd[daemon,ui]". Then open http://127.0.0.1:8080.
To protect it, set settings.ui_auth_token — the API then requires a bearer
token and the UI injects it automatically. For untrusted networks, keep the
default 127.0.0.1 bind and/or put it behind a reverse proxy.
Pages
Page |
What it shows |
|---|---|
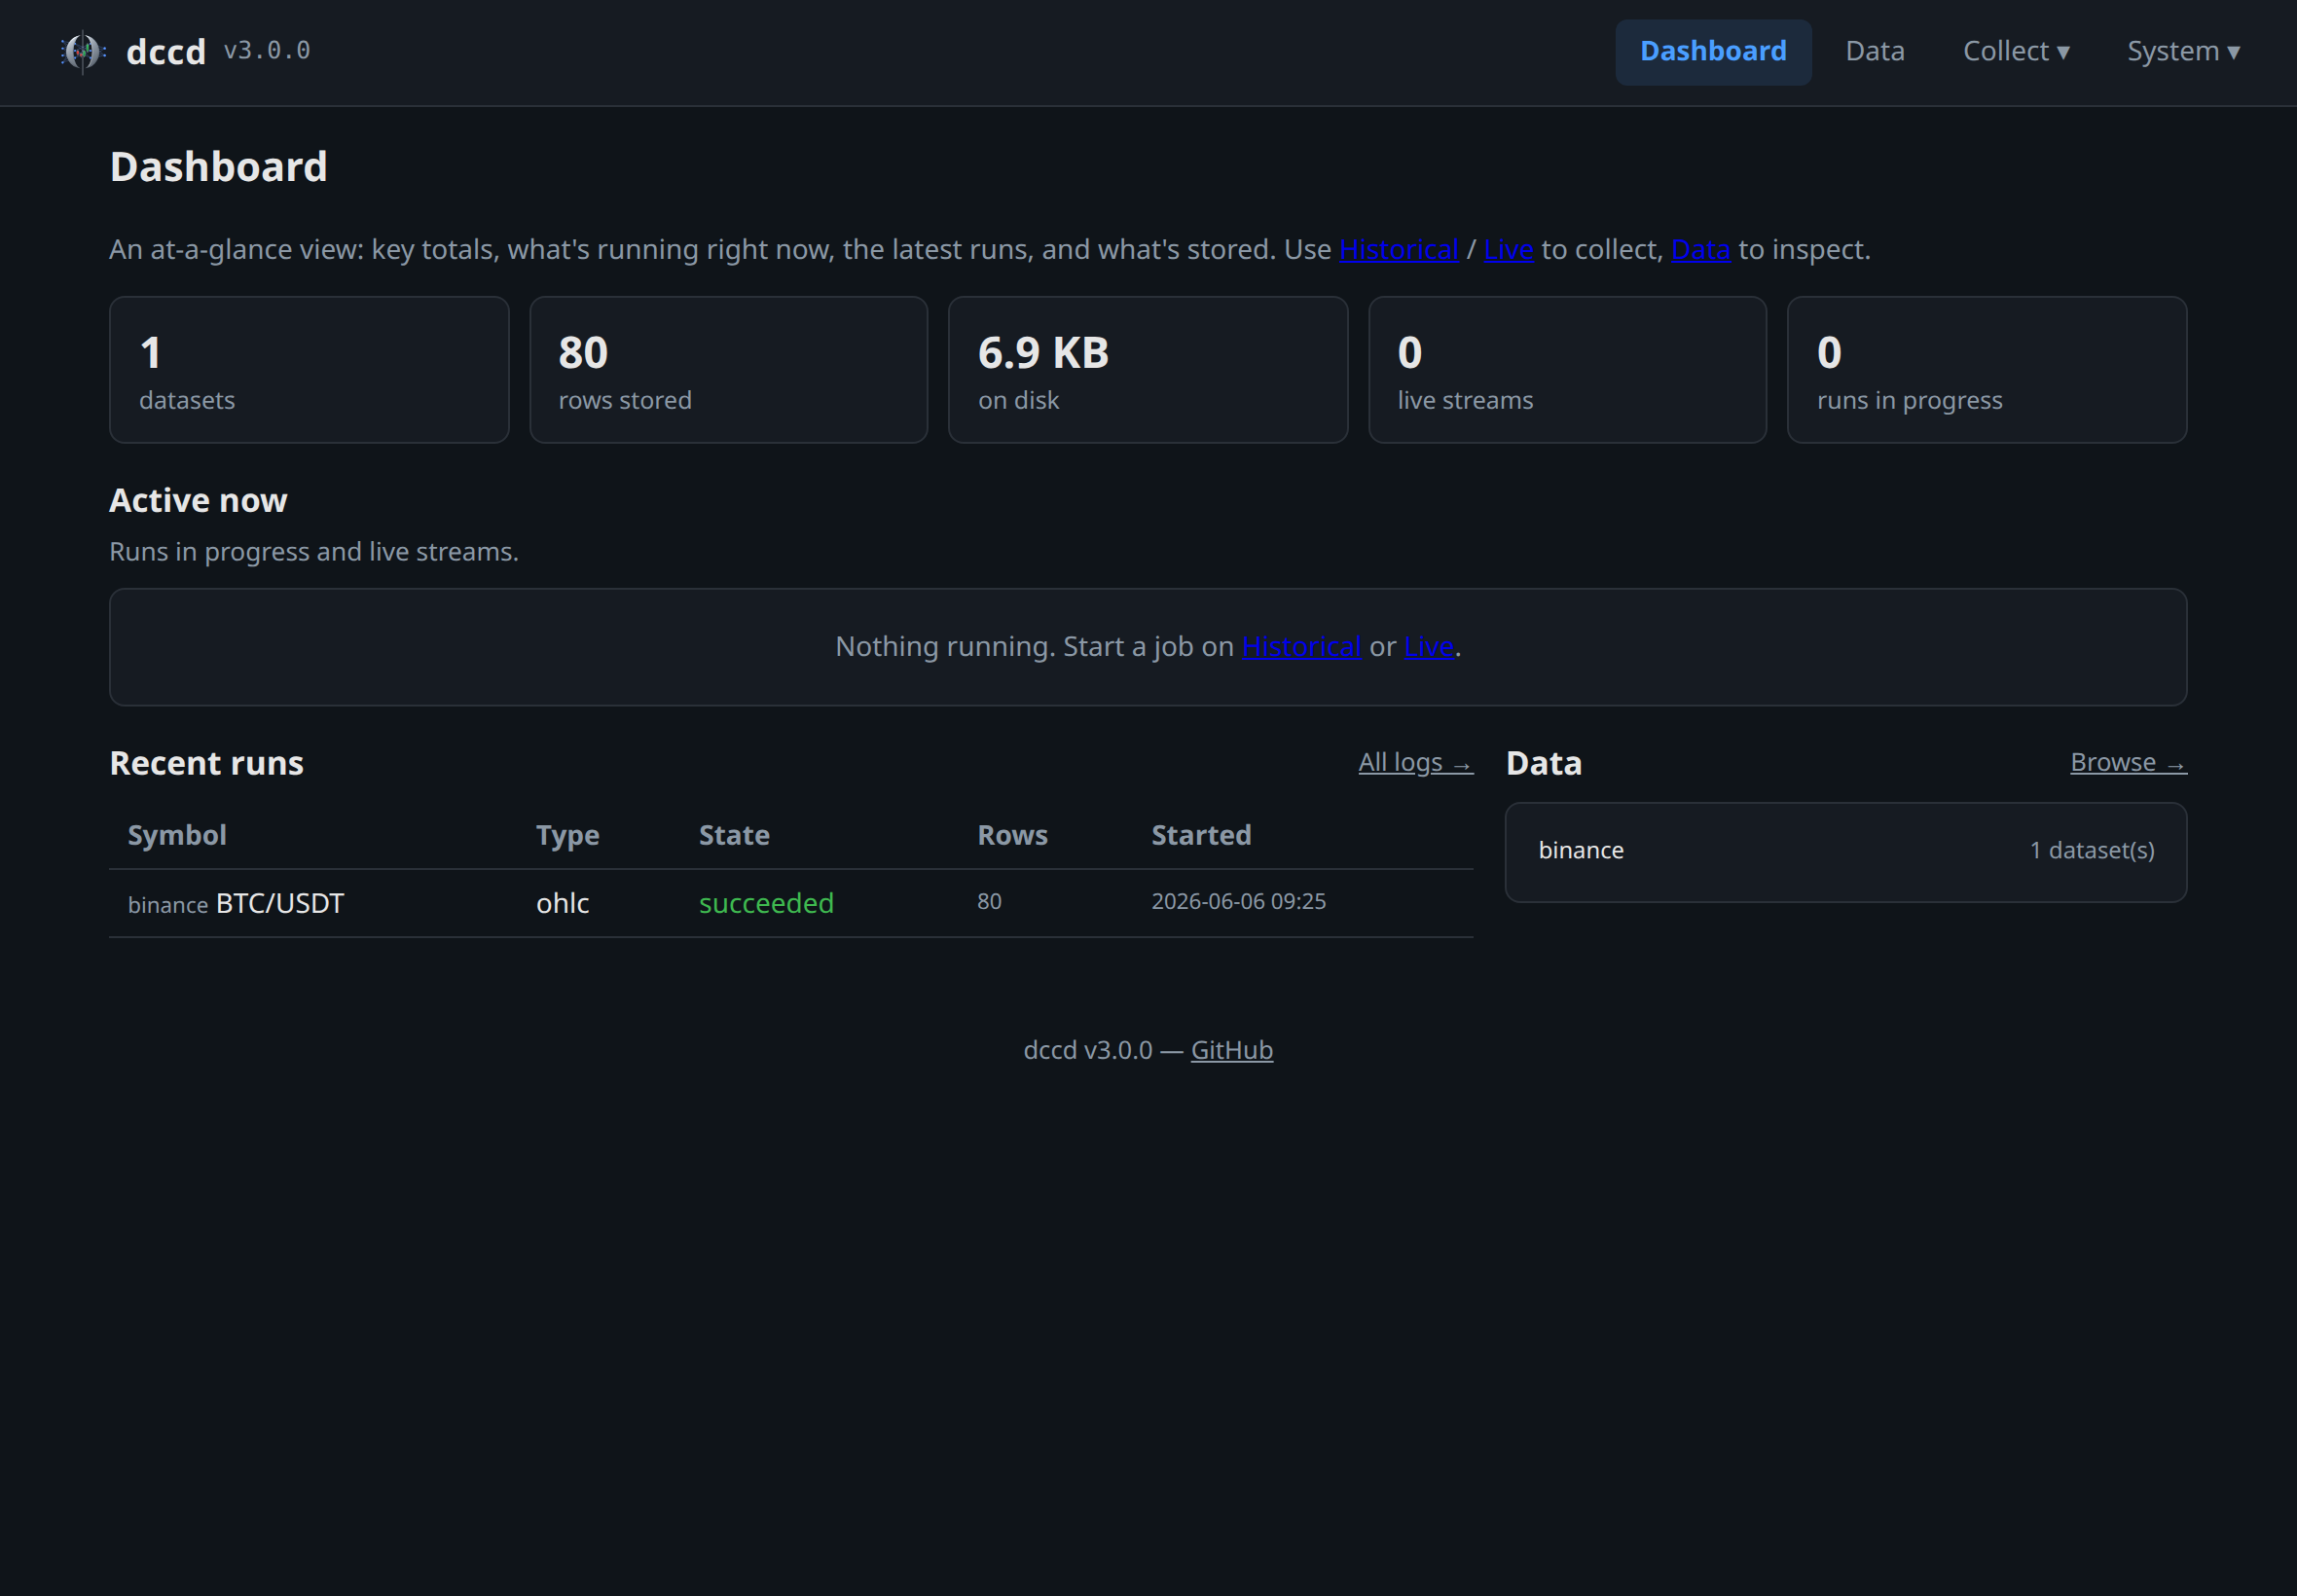
Dashboard |
A KPI bar (datasets, rows stored, on-disk size, live streams, runs in progress), an Active now panel (running backfills with a live progress bar + live streams), recent runs, and a per-exchange data summary. |
Data |
Read-only view of every dataset on disk under |
Historical |
Manage backfill jobs (OHLC and Trades): data-type tabs → per-exchange accordions → one row per dataset with an editable first date, a Schedule (Off / hourly / daily / custom — a recurring backfill run by the daemon), a real coverage bar (first date → today, reflecting stored data and holes), and inline Run / Delete. Run all (page header) and per-exchange Run all trigger every job at once. Order books have no REST history, so they live only on Live. |
Live |
Manage streams (Trades and Order Book): same tabs/accordions, with a liveness indicator (last price/quote + freshness) per stream and inline Start / Stop / Delete. Order-book streams expose a snapshot every N s interval. (OHLC is collected on Historical via a Schedule, not streamed live.) |
Config |
Edit |
Logs |
Recent runs first (each with a human label and an expandable log tail), plus a live SSE console of whatever is running right now. |
Storage |
On-disk dataset breakdown by exchange with sizes and file counts. |
Running backfills & watching streams
On Historical, set a row’s first date and click Run to fill the
missing history. The coverage bar turns live and updates by time covered (and
the row count) as the run progresses; Run becomes Stop, which cancels
cooperatively and keeps everything already collected. The default last start
uses a bounded look-back (short for trades) so a first click can’t trigger a
runaway download.
On Live, the liveness column proves a stream is actually receiving data: a coloured dot (green while data is arriving within the data’s cadence, then amber, then grey), the last value, and how long ago. It is seeded from the last on-disk point, so a page refresh shows freshness immediately rather than “waiting…”; the age reads as a relative “N min ago” for the last day and an absolute date beyond, or the last-run date-time once a stream is stopped.
Note
Data lists all data on disk, independent of your configured jobs (e.g. imported or migrated history). On Historical, datasets on disk that aren’t tracked by a job are listed separately with a + Track button to adopt them as a job.